Having a fast and high-performing store is a key element for the success of any e-retailer. Page loading speed is taken into account by the Google Bot and therefore contributes to your good organic search ranking. Furthermore, users are increasingly demanding regarding their browsing experience on online stores. A technically high-performing store has therefore become a prerequisite for optimising conversion rates and minimising bounce rates or cart abandonment rates.
A user's first arrival on a page of your online store is a crucial element. The loading speed of this page has a direct impact on their perception of the platform.
Increase in bounce rate
A
Google study highlighted the impact of loading time on bounce rate:
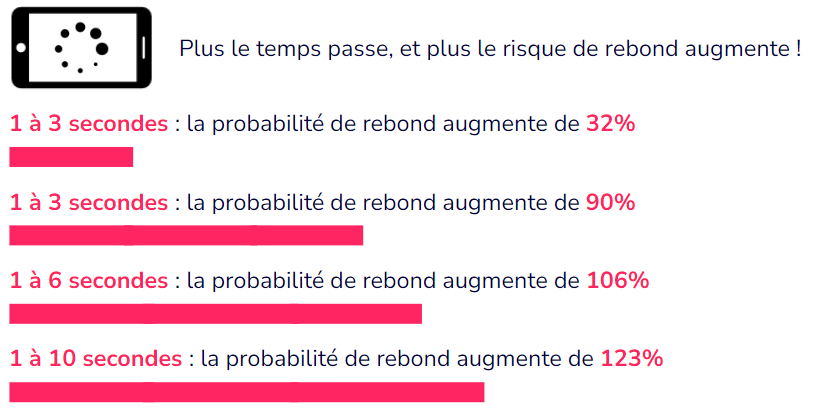
Increase in user bounce rate probability based on loading time.
Decrease in conversion and revenue
The American firm Portent conducted a study on 20 B2C and B2B online stores, and gathered data on over 5.6 million user sessions. It determined that each additional second of loading had a profoundly detrimental effect on the store's conversion rates:
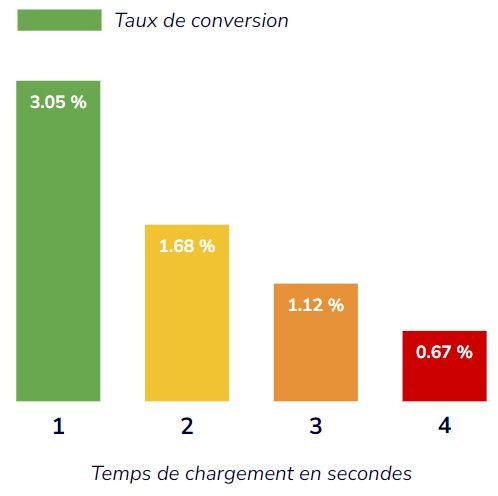
Average online store conversion rate based on loading time in seconds (1 second: 3.05%; 2 seconds: 1.68%; 3 seconds: 1.12%; 4 seconds: 0.67%).
One can then easily estimate the loss of earnings due to poor performance of the online store. If 10,000 people visit your e-commerce site to buy a product for €50, here is the revenue differential:
A page loading in 1 second with a conversion rate of 3.05% will generate €15,250
A page loading in 2 seconds with a conversion rate of 1.68% will generate €8,400
A page loading in 3 seconds with a conversion rate of 1.12% will generate €5,600
A page loading in 4 seconds with a conversion rate of 0.67% will generate €3,350
Which is a revenue difference of almost €12,000 !
Increase in the number of detractors
Consumer expectations are constantly increasing:
83% of online shoppers consider that theexperience offered is as important as the product or service sold
69% of online shoppers state thata single extraordinary experience increases their expectations towards other brands
In this context, poor performance of your store compared to your competitors can severely damage your brand image!
The firm Deloitte conducted a vast
analysis of online user behaviour. Their work reports that
62% of online shoppers are willing to share their poor shopping experiences with close ones.
Conversely, an optimised store can transform these detractors into promoters! 72% of shoppers are willing to share their good experiences with others, and 67% are more likely to spend more!
Understanding Core Web Vitals
The Google Chrome teams have defined main metrics directly impacting user experience: the LCP, theINP and the CLS. They represent how users perceive the loading speed of a web platform and its interactivity.
The LCP (Largest Contentful Paint) is the time required to display the largest element on the part of the page visible on screen. An LCP below 2.5 seconds is considered good, whereas an LCP exceeding 4 seconds will generally lead to frustration.
TheINP (Interaction to Next Paint) corresponds to the time required to trigger a visual change after user interaction with an element. If it's too long (over 500 ms), the user will feel that their click hasn't triggered anything. Furthermore, INP is measured over an entire session, to only retain the worst time recorded.
The
CLS (Cumulative Layout Shift)
evaluates the visual stability of a web page. The idea is therefore to measure how often users experience unexpected layout shifts (for example, text abruptly jumping position or a CTA moving just before it's clicked). This score is more difficult to calculate (the formula can be found
here) but it should be as low as possible (below 0.1).
To optimise LCP, it's necessary to pay attention to two other key metrics that directly impact it:
The TTFB (Time To First Byte) represents the time it takes for the first byte of data to travel to and from the server to the browser, after the user has made a request (e.g. clicked on a link). For a high-performing site, aim for a TTFB below 0.8 seconds to avoid the user experiencing a feeling of delay.
The FCP (First Contentful Paint) represents the time it takes for the first content (a text or an image in particular) to display on the page. In fact, it is intrinsically linked to TTFB. You should aim to achieve an FCP below 1.8 seconds to give the user a feeling of fluidity. It may therefore be interesting to display a simplified visual (wireframe) representative of the element that will appear, until the final content is loaded.
In parallel with UX/UI challenges, it is by working on the optimisation of these KPIs that you can guarantee an optimal browsing experience for your online store's customers.
There are two main tools to measure the performance of your online store: the online platform Google's PageSpeed Insights as well as the performance tracking dashboard directly accessible from the back-office of Shopify.
PageSpeed Insights
PageSpeed Insights is a tool developed and made available for free by Google, which enables the analysis of web page performance. The platform provides reports on the speed and efficiency of page loading and pinpoints the elements that may be slowing down their display.

Example of performance results obtained with the PageSpeed Insights tool for the web version of the Galadrim agency's website.
PageSpeed Insights therefore allows you to obtain information for each Core Web Vital that we defined above, but also recommendations to improve your website's performance.
Shopify performance tracking dashboard
The performance tracking dashboard offered by Shopify includes the Core Web Vitals defined by Google:
Loading speed (Largest Contentful Paint)
Interactivity (Interaction to Next Paint)
Visual stability (Cumulative Layout Shift)
Each indicator is classified as “Good”, “Moderate”, or “Bad”.

Example of Shopify performance tracking dashboard showing a loading speed index, an interactivity index, and a visual stability index.
The significant advantage of this dashboard is that it presents data from your online store's users, whereas the KPIs generated by PageSpeed Insights are based on a simulation of a user session executed by a bot!
Shopify allows you to filter results to display only web or mobile user data to determine if the store needs further optimisation for a particular device. It is also possible to easily obtain additional information on each metric by accessing the detailed reports automatically generated by Shopify!
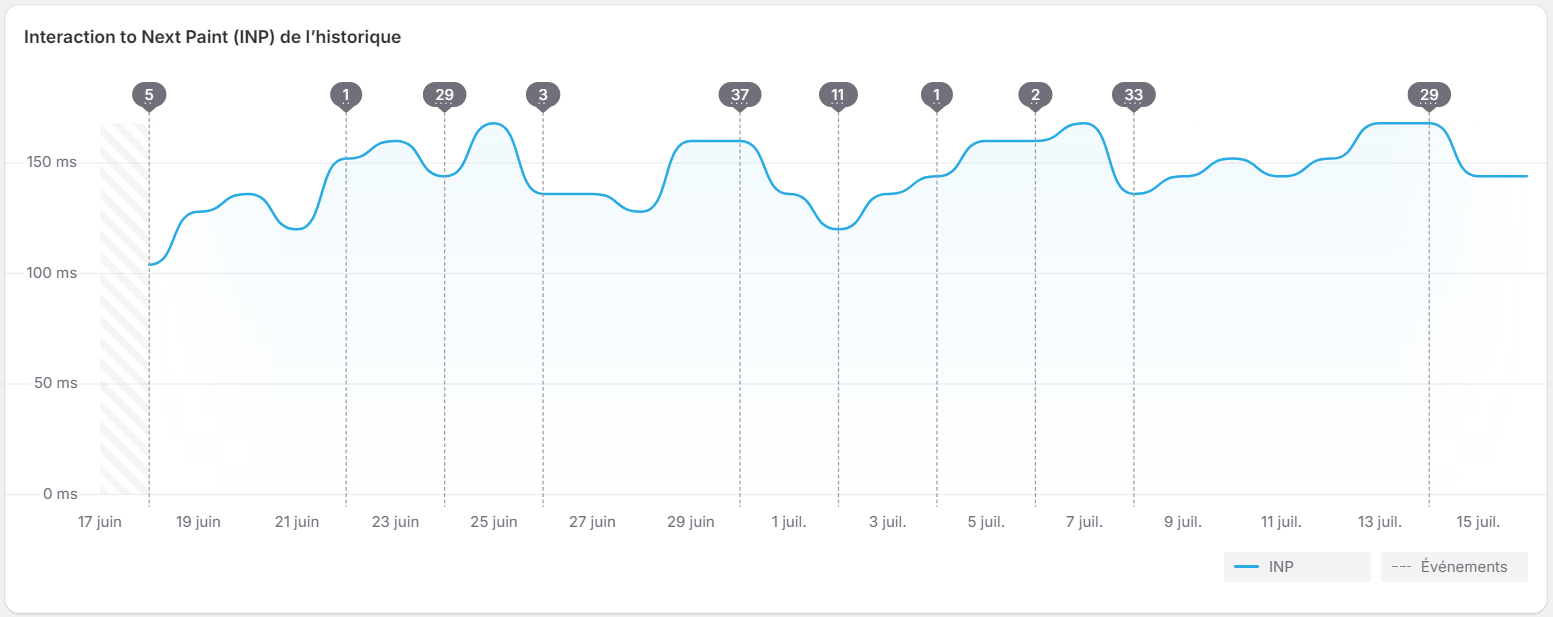
Example of Shopify chart (Interaction to Next Paint INP).
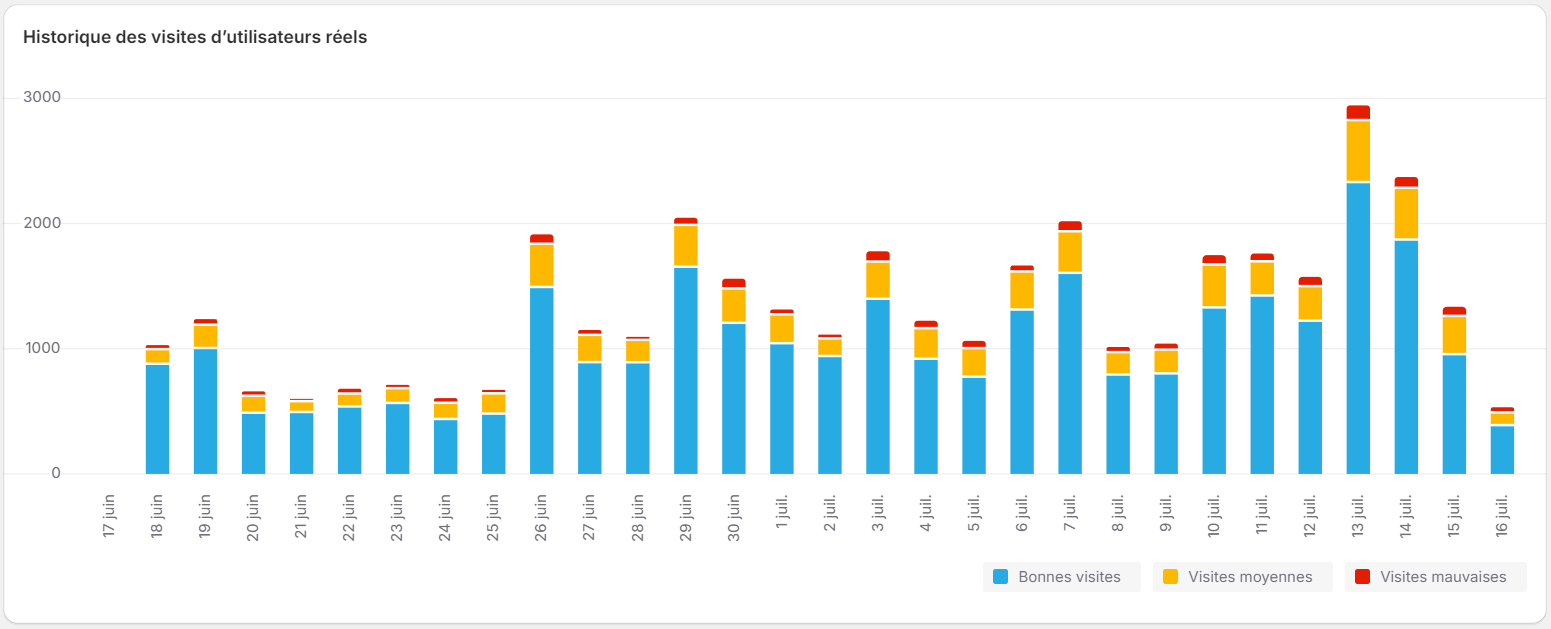
Example of Shopify chart (real user visit history).
The CMS thus provides each merchant with a comprehensive tool allowing them to visualise their store's performance without technical knowledge.
Understanding Shopify's Technical Architecture
Shopify is a self-hosted solution which implements various tools and services to ensure the stability and scalability of your store worldwide:
Shopify's technical teams continuously work on improving their server performance. In 2023, Shopify presented the
improvements made to their infrastructure, which resulted in a 35% acceleration for CMS-based shops.
Avoid complex Liquid code
Shopify's Liquid language is very efficient and constantly optimised by their technical teams. However, certain common development errors particularly affect its performance. This is notably the case for nested loops or some numerous queries concerning unnecessary data. In some cases, products marketed on the store contain a large number of metadata, and poorly designed code can perform hundreds of checks of these properties on the product page, without any real benefit.
In cases where this degree of complexity is justified by the nature of your products and the functioning of your shop, it is still possible to re-architect your approach. For example, rather than organising a mega menu with loops, it's possible to render elements immediately visible in Liquid, and underlying elements in asynchronously loaded JavaScript.
Handle render-blocking resources
When a browser parses HTML, it identifies links to synchronous CSS or JavaScript files. It then downloads these files before continuing to render the rest of the page. Certain resources are particularly resource-intensive, and lead to particularly long delays, which can hinder user experience.
Any resource slowing down rendering should not be removed. For example, the CSS that styles content above the fold must be retained to avoid layout shifts or quick flashes of unstyled content. Conversely, it is possible to use the lazy loading (deferred loading) for files located below the fold to achieve better overall performance.
Similarly, you can cache static resources such as images and certain JS files to reduce downloads of recurring components.
Properly integrate anti-flicker snippets
TheA/B testing is one of the best tools at your disposal to optimise your shop's UX/UI. However, it can cause a “Flicker effect”, i.e. the very brief appearance of content “A”, almost immediately replaced by content “B”, or an unstyled component. It therefore very negatively affects the user experience and risks increasing the bounce rate.
To prevent this type of behaviour, it is possible to add anti-flicker snippets. They delay the page display, up to a specific point, to ensure that the correct content is ready for rendering. However, these same snippets have a negative effect on performance.
It is therefore important to ensure that the JavaScript code implemented closes these snippets once the tests have been carried out during the session, or disables them if no test has been implemented. In cases where A/B tests are managed via an external application, it is possible to encapsulate the scripts within a Liquid instruction that checks the test's status, and deactivates the corresponding code if it is not relevant.
Avoid excessive HTML code
The mega-menus are very common on e-commerce platforms, and are very useful to quickly present many entry points to buyers. However, they generate a great many DOMs (document object models). Similarly, shops generally have two versions of a menu (one for desktop and the other for mobile) instead of changing it dynamically via CSS. This therefore doubles the number of DOM elements.
In some cases, this excessive HTML sizing within the page can cause slowdowns, and can, for example, be remedied by:
A single menu organised via CSS to display correctly on web and mobile.
The use of Liquid to load elements to be displayed as a priority, and JavaScript to retrieve the remaining data and render it in the background.
Furthermore, ensure that at least one menu is rendered server-side to help the Google Bot index your content.
Optimise images
Image sub-optimisation is a common problem on many online shops. Overly heavy images can both block the initial rendering of a page (when the user accesses it for the first time) and the rendering of elements during navigation (e.g., when scrolling). Opt for a modern image format and efficient such as WebP and ensure you load a size adapted to the user's device (desktop, mobile or tablet). On mobile, images can have a lower resolution, for example.
Another common problem, easily identifiable via the PageSpeed Insights tool, is the
absence of explicit dimensions on images. The browser will treat the component as if its height were 0, and once the image is loaded, the remaining content will be abruptly shifted downwards. The simplest solution to avoid this behaviour is to
define the height and width attributes within the tag
![]()
in the CSS.
If you are building your own theme, or have hired a service provider to do so, ensure that the basic CSS for all images is defined from the beginning of the project. It can then be manually adjusted later according to needs.
Some complementary monitoring tools
In addition to PageSpeed Insights and Shopify's performance dashboard, you can rely on a few additional tools to further study your online shop.
Lighthouse Treemap
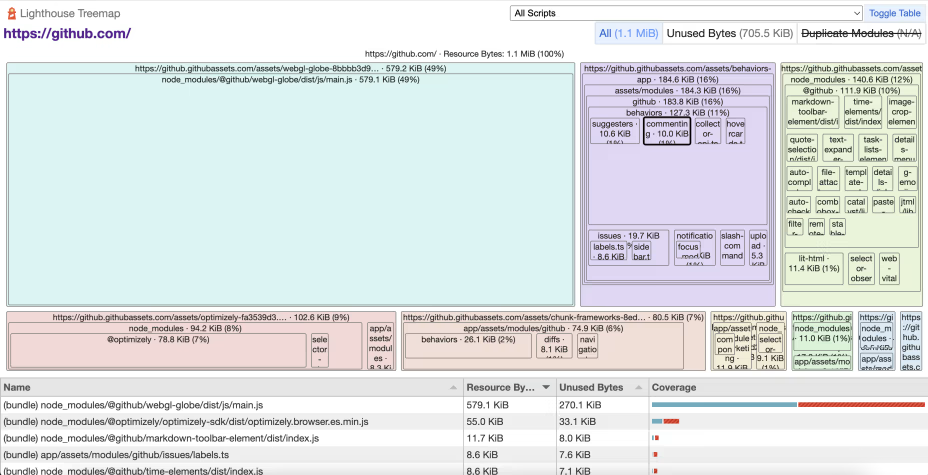
Lighthouse Treemap is a JavaScript bundle visualisation tool, accessible from PageSpeed Insights, which makes it easier to understand the behaviour of the code present on each page of your site. Data is displayed by category and size. Each box represents a JavaScript file or module, and its size depends on the number of bytes it represents.
This visual approach makes it easier to identify elements that can reduce shop performance. It is particularly interesting to focus on code from third-party applications, to gauge its impact in relation to its relevance and utility.
Performance DevTools
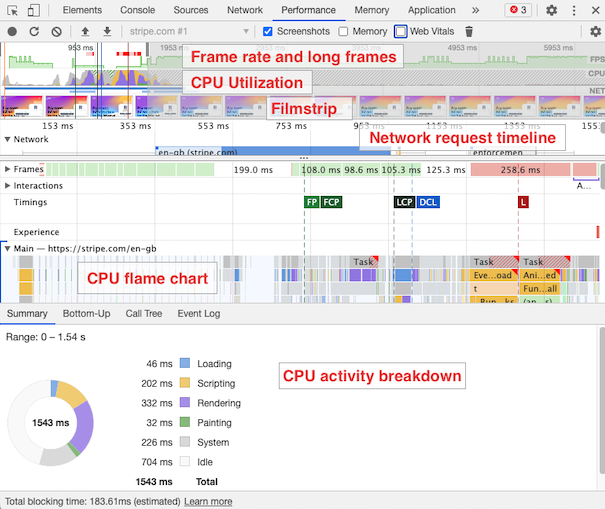
The tab DevTools Performance is directly accessible from the Chrome browser. It allows you to measure the loading and execution time of scripts on a web page and present the results in the form of chronological charts.
Several charts are particularly interesting for guiding your analyses:
The CPU usage timeline, to identify operations consuming the most resources.
The Filmstrip Rendering, which represents at what moments critical content becomes visible to users.
The network requests timeline, which displays the initiation, execution, and completion time for each request.
The Web Vitals chart which displays details on LCP, CLS, and INP.
With this tool, it is even possible to block third-party domains to compare performance, and to isolate the external elements most detrimental to your platform's performance.
WebPageTest
WebPageTest is a tool for carrying out speed tests for any page of the site and obtaining performance reports. It therefore provides access to information similar to PageSpeed Insights and the dashboard provided by Shopify.
However, the tool also offers a configurator to refine the tests conducted, notably by defining:
The location in the world from which the simulation is carried out (which is interesting if you have a significant international customer base)
The browser (Chrome, Firefox, or Safari)
The connection speed
The screen resolution
Furthermore, WebPageTest provides historical data to determine if the site is faster or slower than before.
Conclusion
As a self-hosted CMS, Shopify handles the most complex aspects of deploying and scaling an online shop. In parallel, you retain control over many parameters to optimise your platform's performance. The technical performance of your shop has a very significant impact on your brand image and the buyers' experience. Consequently, aiming for a fast and responsive site is paramount to maximising your turnover.
Galadrim has been supporting players of all sizes for 7 years, across many sectors, in the development and continuous improvement of their online shops. Our teams are at your disposal to understand your needs and evaluate the most relevant solutions to support you in the growth of your activities.