Is your TypeScript project starting to grow and become slow, but you don't know what's causing these slowdowns? We're going to look at an example to find out which parts take the longest during compilation.
Which tools to use?
We're going to take as an example
this GitHub repo. It's a React project with a number of i18n translation keys (8 workspaces of 150 keys, so 1200 keys).
TypeScript offers us a few tools to investigate performance issues related to compilation.
To start, when launching the TypeScript compiler, you can pass it the extendedDiagnostics parameter.
npx tsc --extendedDiagnostics
gives something like:
Files:                         90
Lines of TypeScript:           83
Lines of JavaScript:            0
Lines of JSON:               2448
Parse time:                 0.42s
ResolveModule time:         0.02s
ResolveTypeReference time:  0.00s
Program time:               0.48s
Bind time:                  0.20s
Check time:                 2.64s
Emit time:                  0.00s
Total time:                 3.32s
Done in 3.53s.
We can see that on this repo:
Alright, it's good to know that type checking takes time, but it would be better to know which lines in the code are responsible!
Well, that's good news, we're going to be able to find it out in 2 steps.
First, we're going to generate debug files during compilation:
npx tsc --generateTrace <path>
(you need to replace
with a valid path where tsc will create a folder, then write the compilation debug files)To read this debug file, we're going to use the "Performance" tab of the development tools (in a Chromium-based browser).
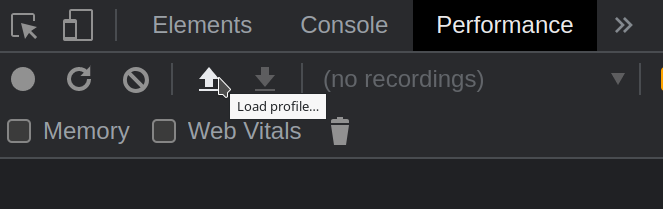
There you'll find a "Load profile..." button to load a debug file (trace.json):
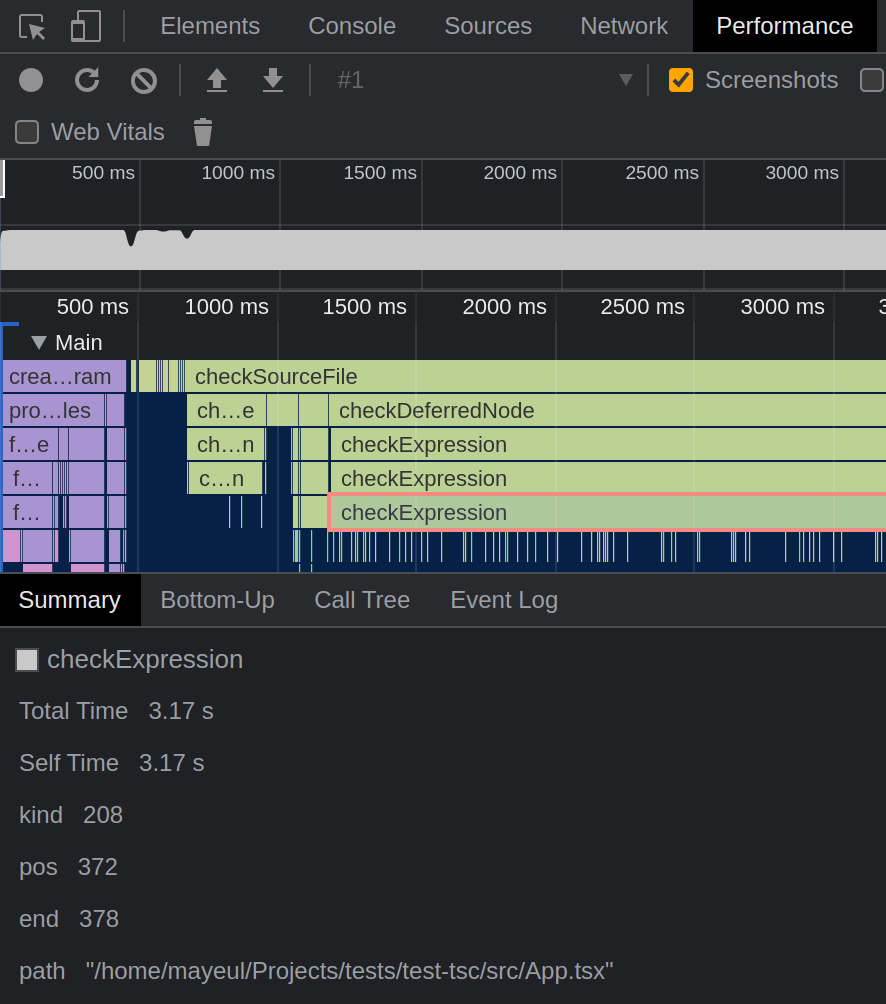
Once the file is loaded, you'll have to navigate through the interface as best you can and click on the parts of the graph that take the most time. For example:
In the image, we see that a "checkExpression" type operation in the App.tsx file takes 3.17 seconds
We can know exactly what this corresponds to in the code thanks to the indication: pos 372 end 378
You would therefore need to open App.tsx and look from character 372 to character 378.
Alright, it's a bit of a pain, I admit; it would be good if a tool could automatically find the longest parts of the compilation and calculate the line / column for us...
To use it, nothing could be simpler:
npx @typescript/analyze-trace <path>
(replace
with the path to the folder where we generated the debug files)In our example, this will give:
Hot Spots
└─ Check file /home/mayeul/Projects/tests/test-tsc/src/App.tsx (3700ms)
   └─ Check deferred node from (line 17, char 27) to (line 18, char 34) (3186ms)
      └─ Check expression from (line 18, char 11) to (line 18, char 21) (3172ms)
         └─ Check expression from (line 18, char 22) to (line 18, char 30) (3170ms)
            └─ Check expression from (line 18, char 23) to (line 18, char 29) (3170ms)
If we look in App.tsx at line 18, column 23 (exactly our character 372 from earlier), we can see that the problem is in keys.map()
(the App.tsx file)
export const App = () => {
  const { t } = useTranslation();

  const keys: AllI18nKeys[] = [
    "anotherTest:anotherTest-100",
    "hehe:hehe-30",
    "login:login-103",
    "common:common-126"
  ];

  return (
    <div>
      <h1>{t("login:login-0")}</h1>

      {keys.map((key) => (
        <p key={key}>{t(key)}</p>
      ))}
    </div>
  );
};
Now we can wonder why it's slow.
In the
paragraph related to unions, we notice that Microsoft advises against using unions with numerous elements, and the AllI18nKeys type is a union of 1200 translation keys...
And there you have it! Now you're able to find out where compilation slowdowns on your project come from. However, resolving these issues is another matter 😉